Leveraging SRUM for Incident Response
November 5, 2023
Shanna Daly
Back in 2019 when I was running my own consulting gig, Caccia Cybersecurity, I learnt about a new (at the time) artefact that had recently been discovered and ‘decoded’. The SRUM. This blog post is based on a presentation that I gave in 2019 at The 2019 ICSL MRE conference in Sydney, and the Carbon Black Partner IR summit for APAC. In going through my archives of presentations, I decided to write up these presentations into blog posts as the information is still relevant and I can update where needed.
In the world of Incident Response (IR), challenges are a given. In this blog post, I’ll take you through an IR case that presented a unique set of hurdles and how the unexpected hero, the SRUM database, came to the rescue.
The Challenge: (Un)usual Incident Response Scenario #
Have you ever found yourself in the following predicaments?
- You’re called in for an urgent incident, only to discover it happened a month ago.
- The local IT admin attempted IR before you, leaving a trail of questions.
- There are no event logs to work with.
On one hand it’s easy enough to know which systems had ransomware deployed on it, but what about scoping those systems that had mimikatz or other applications or malware installed by an attacker on it? Or what about finding out what else an attacker may have run while they were logged onto the system, what if they installed TeamViewer somewhere and have a backdoor back onto the network the minute you think you have recovered?
Scoping an incident is essential in order to fully understand the impact of the incident and ensure that mitigation and recovery strategies have a greater chance of success.
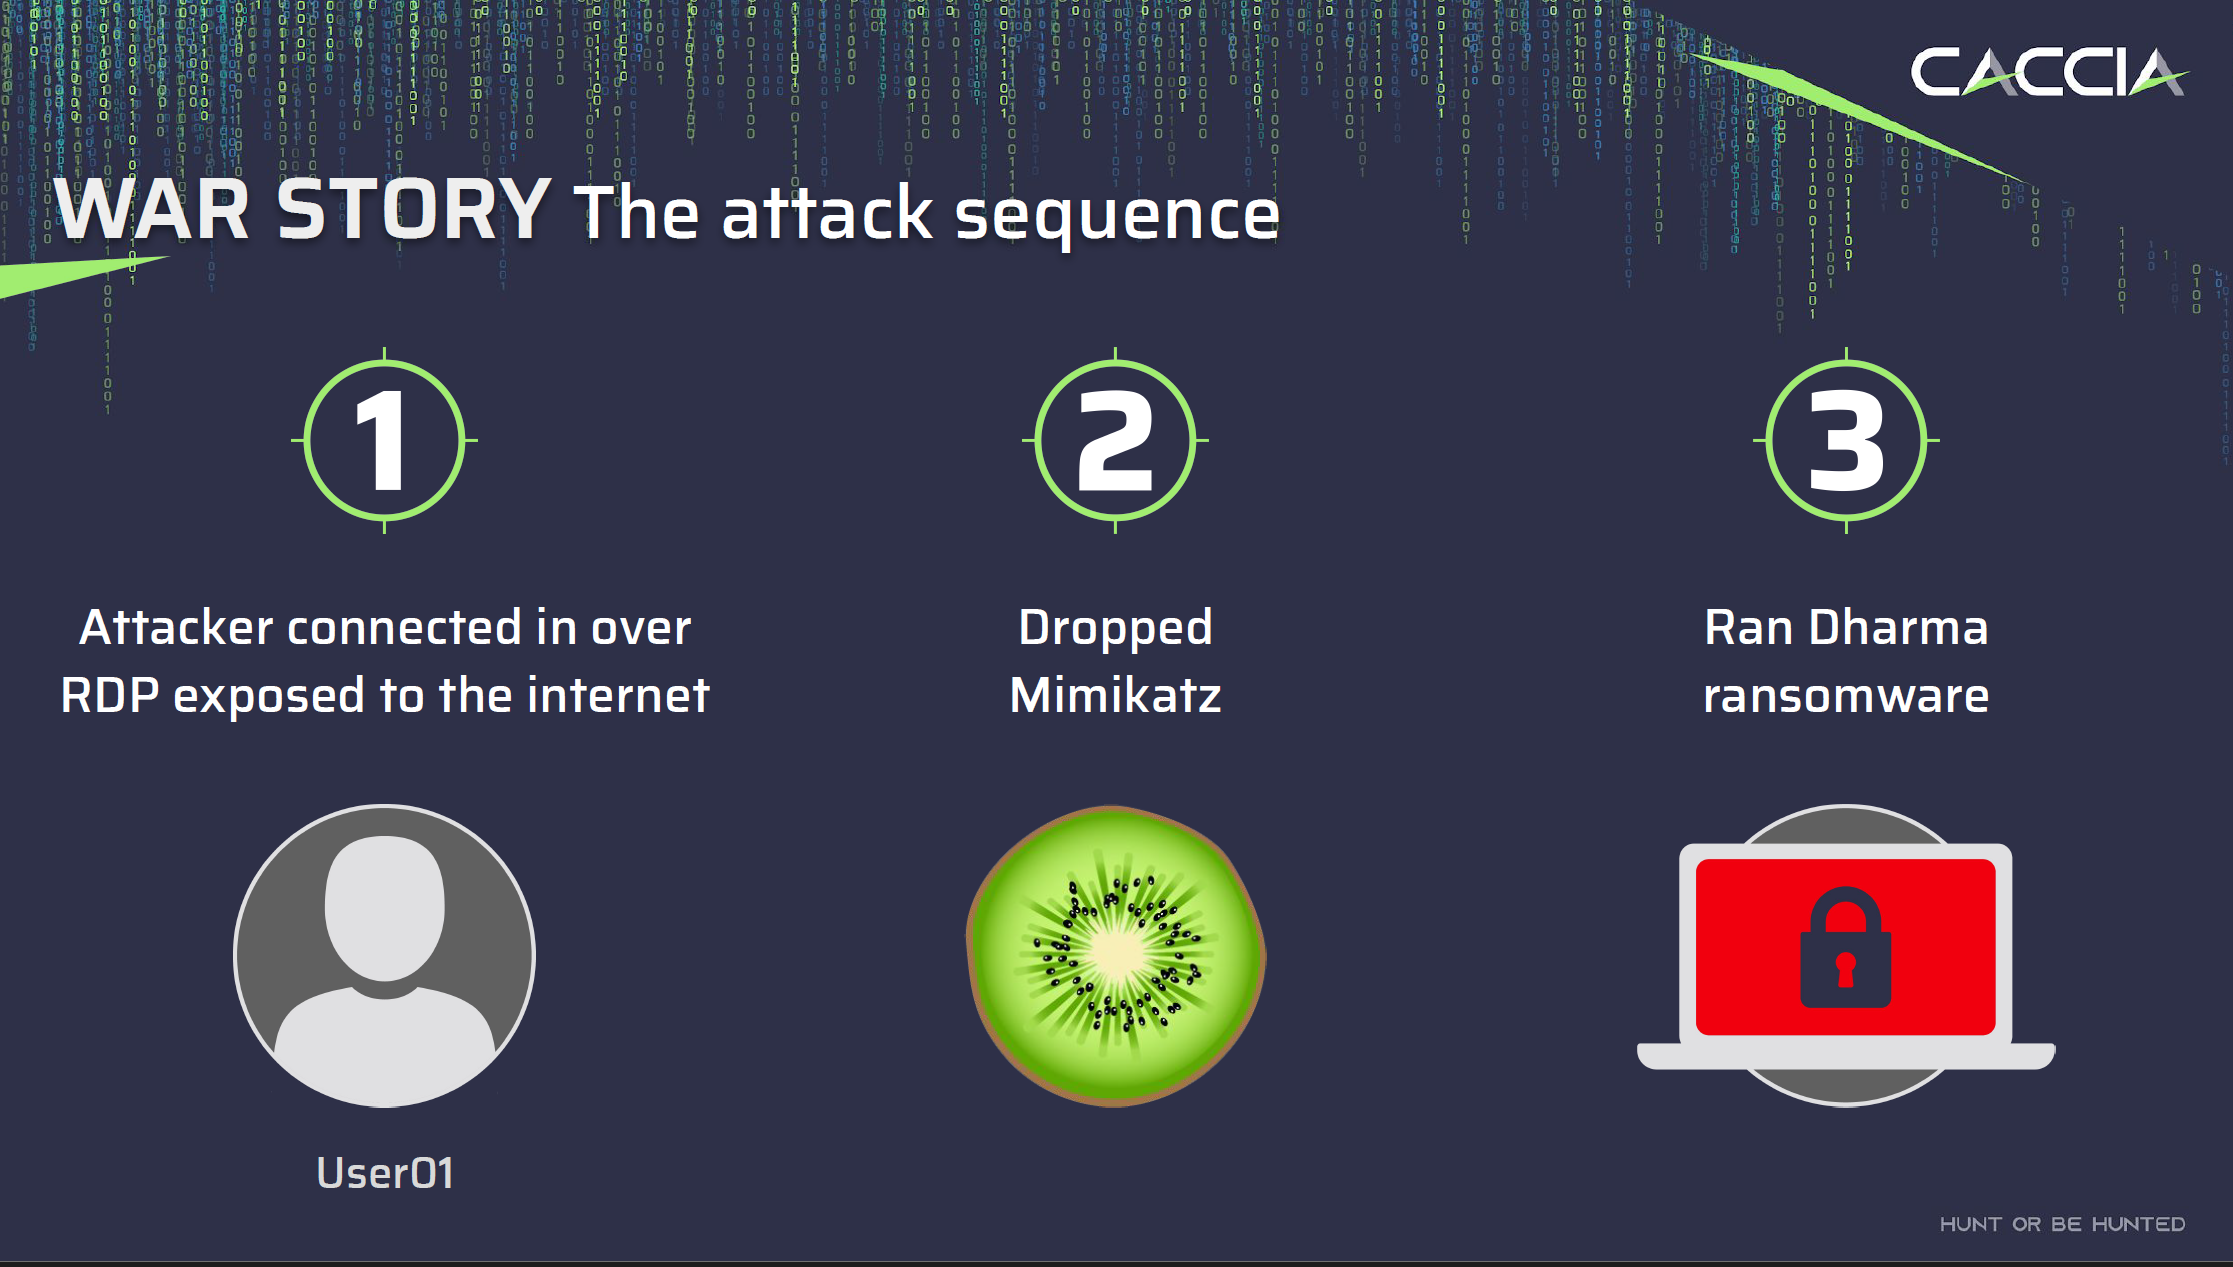
While these situations may seem daunting, they can also provide interesting case studies. Such was the case for me when I had to piece together a timeline involving an attacker who gained access to a network via RDP, ran Mimikatz on multiple systems, and unleashed Dharma ransomware.
The Role of SRUM: A Hidden Gem in Forensics #
When dealing with incident response, investigators often rely on a set of familiar tools, techniques and artefacts. However, sometimes a lesser-known artefact can prove to be the key to unlocking critical insights. One such artefact that has emerged as a hidden gem in the world of digital forensics is the Windows System Resource Usage Monitor, or SRUM.
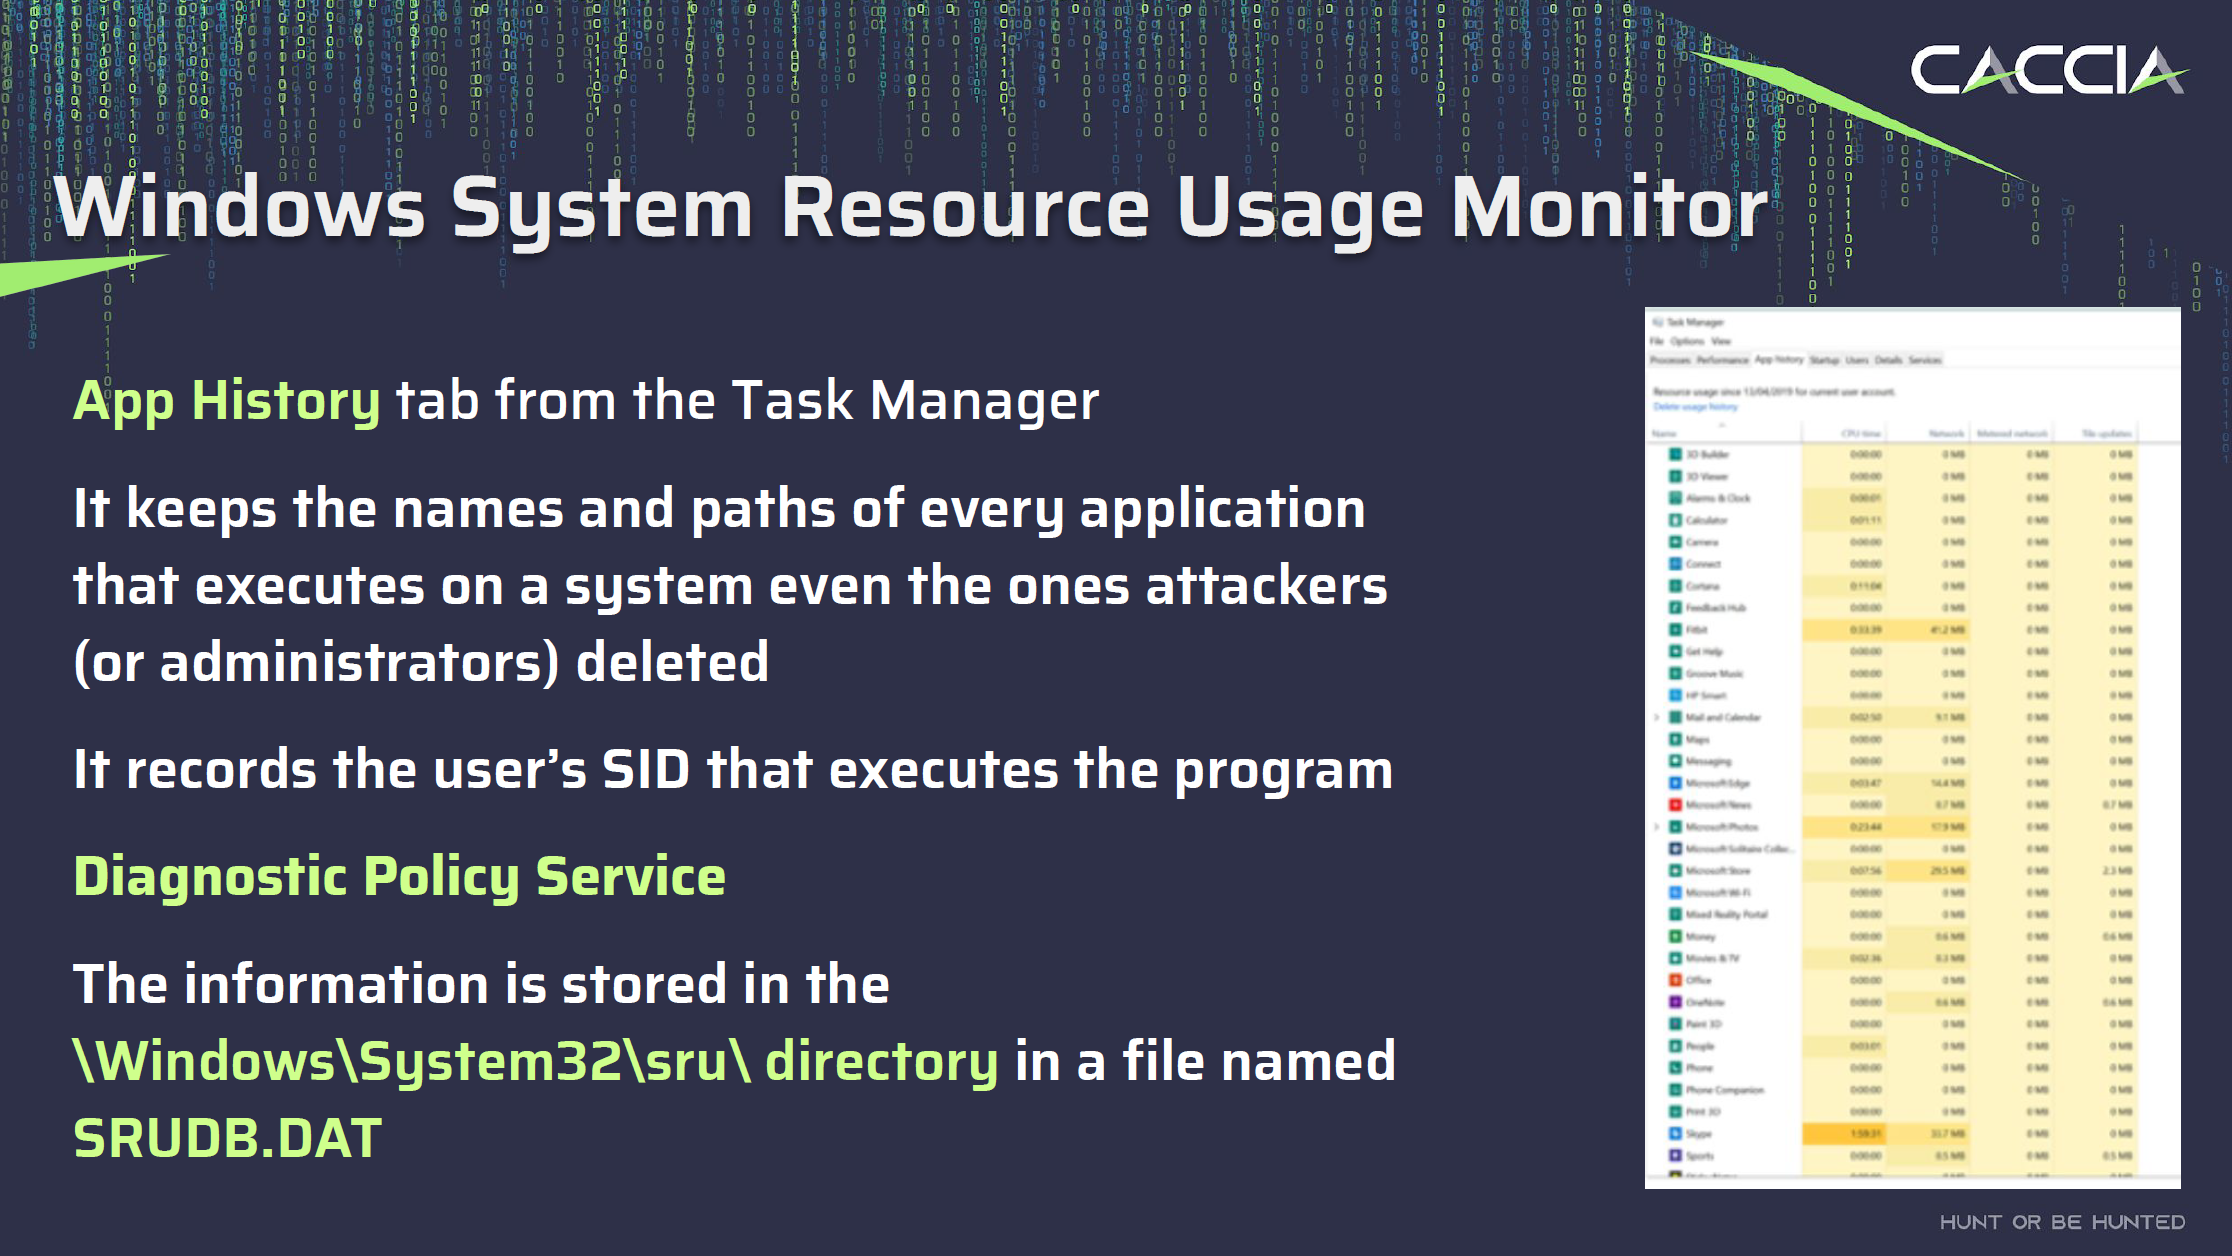
SRUM is a relatively obscure component that many users may not be familiar with, however the information held within the database is accessible through the “App History” tab in Task Manager. It serves as a valuable forensic resource by maintaining a comprehensive record of every application that executes on a system, including those that may have been intentionally deleted. This record even includes details like the user’s Security Identifier (SID) responsible for executing each program.
The information collected by SRUM is stored within the SRUDB.DAT file, which follows the Windows Extensible Storage Engine (ESE) database format. Introduced in Windows 8, SRUM is a part of the “Diagnostic Policy Service.” The SRUM can provide insights into applications and executions that might otherwise be missed.
In essence, SRUM acts as a silent observer, meticulously cataloguing the activities of every application, whether legitimate or malicious, across the system. This includes actions taken by attackers, making it a goldmine of information for digital forensics investigators.
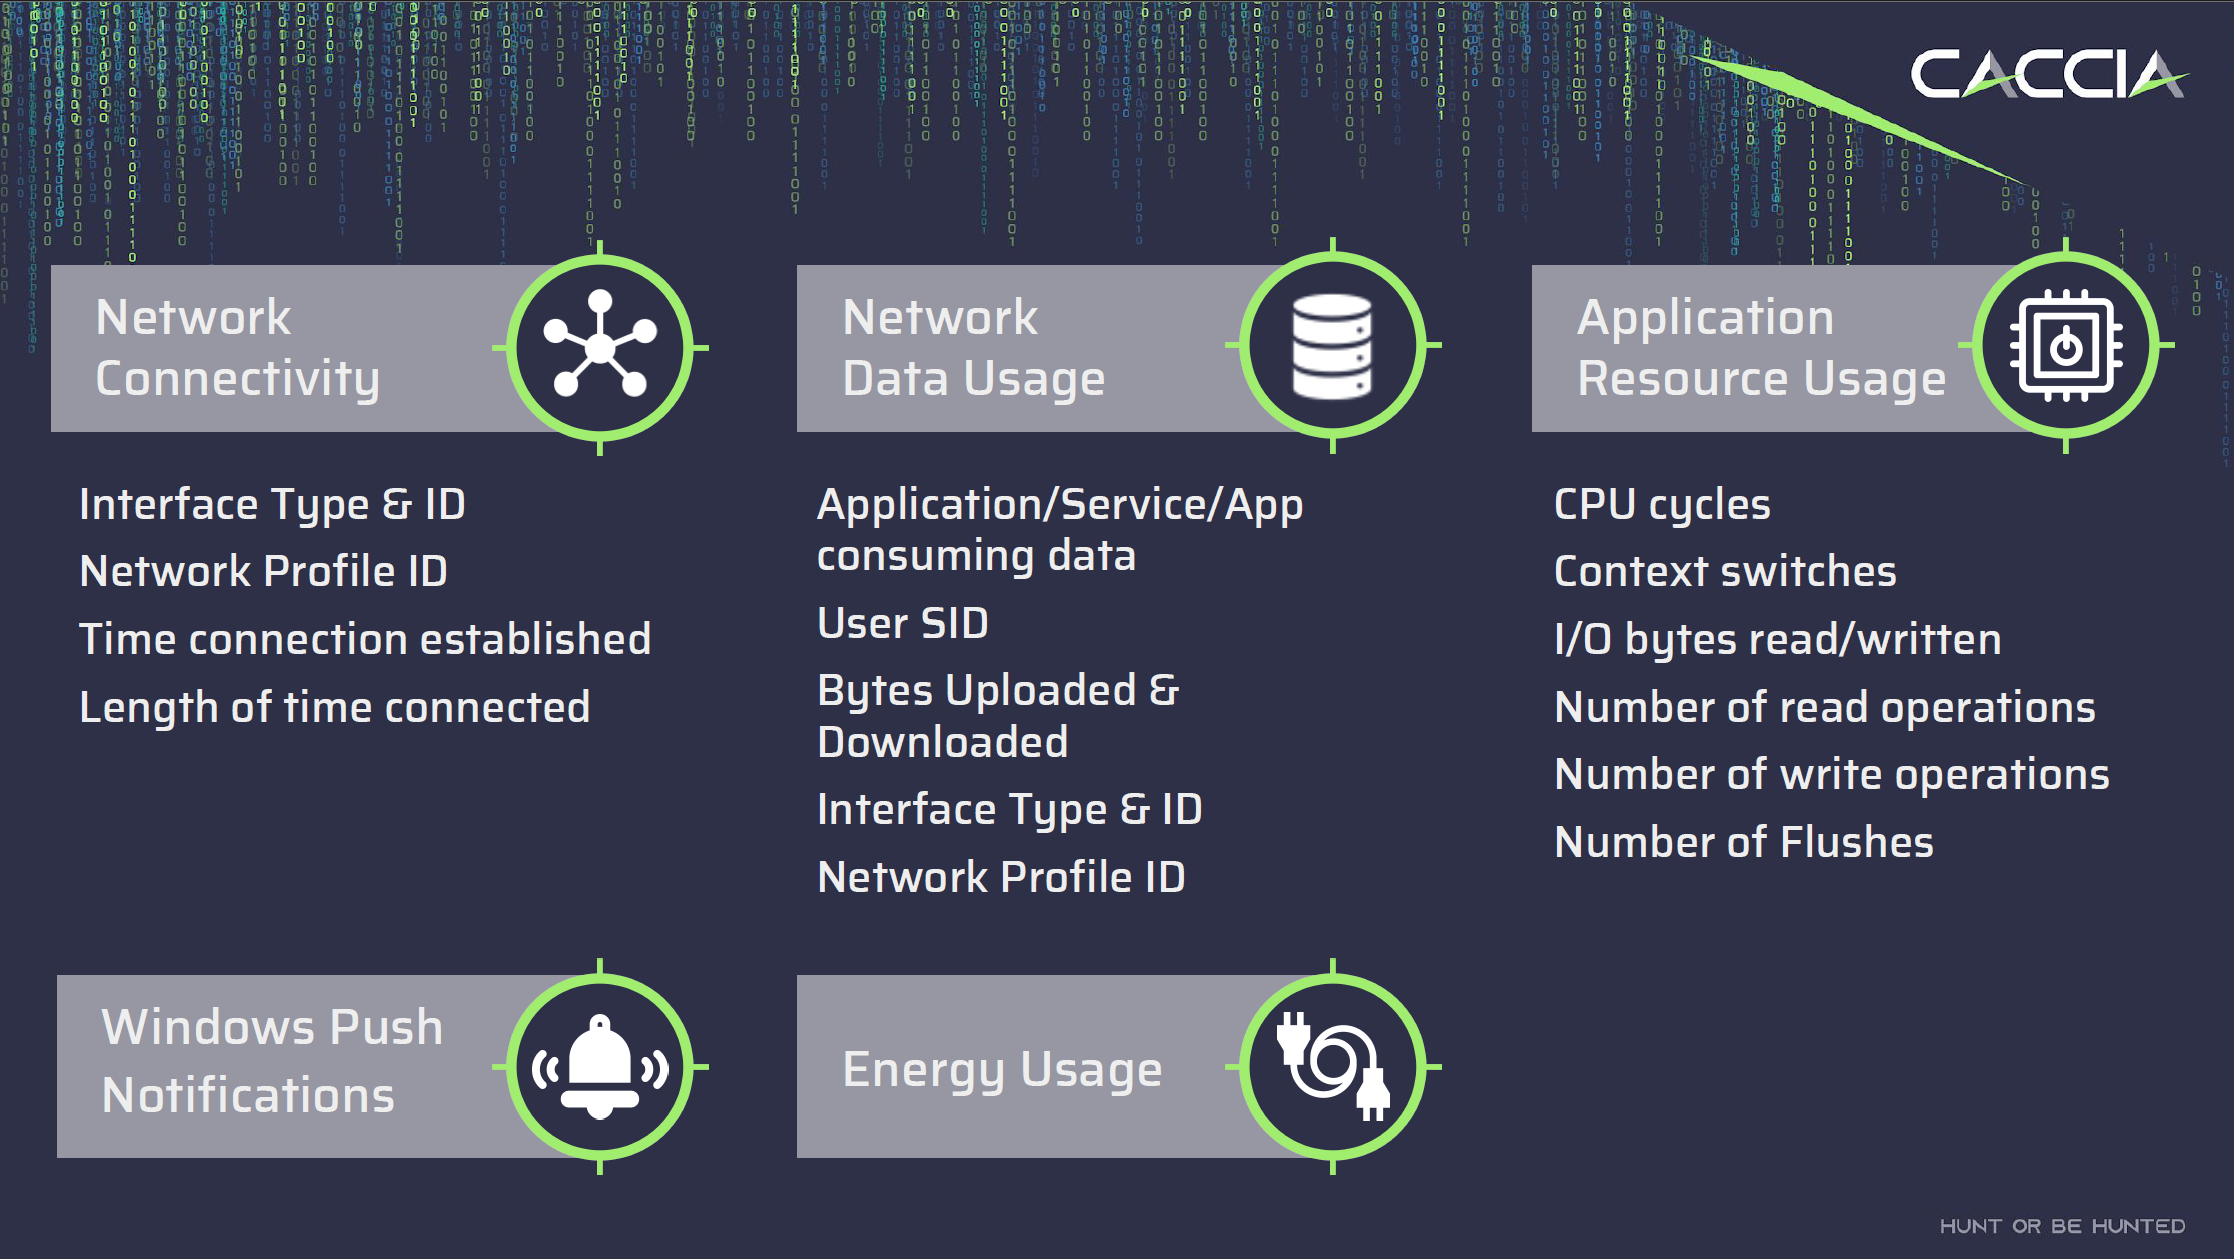
What’s Inside the SRUM Database #
The SRUM database contains valuable information on various aspects of a computer’s usage and performance, including:
Application Execution History: Records information about when and which applications were launched, and how long they were running.
User Accounts: Logs user logins, logouts, and session durations.
Network Connections: Stores data on active network connections, including applications involved and data exchanged.
Resource Utilization Metrics: Tracks CPU usage, memory consumption, and disk I/O statistics.
Timestamps and Metadata: Associates entries with timestamps and metadata for chronological context.
Understanding SRUM: Key Insights #
Here are some key technical insights about SRUM:
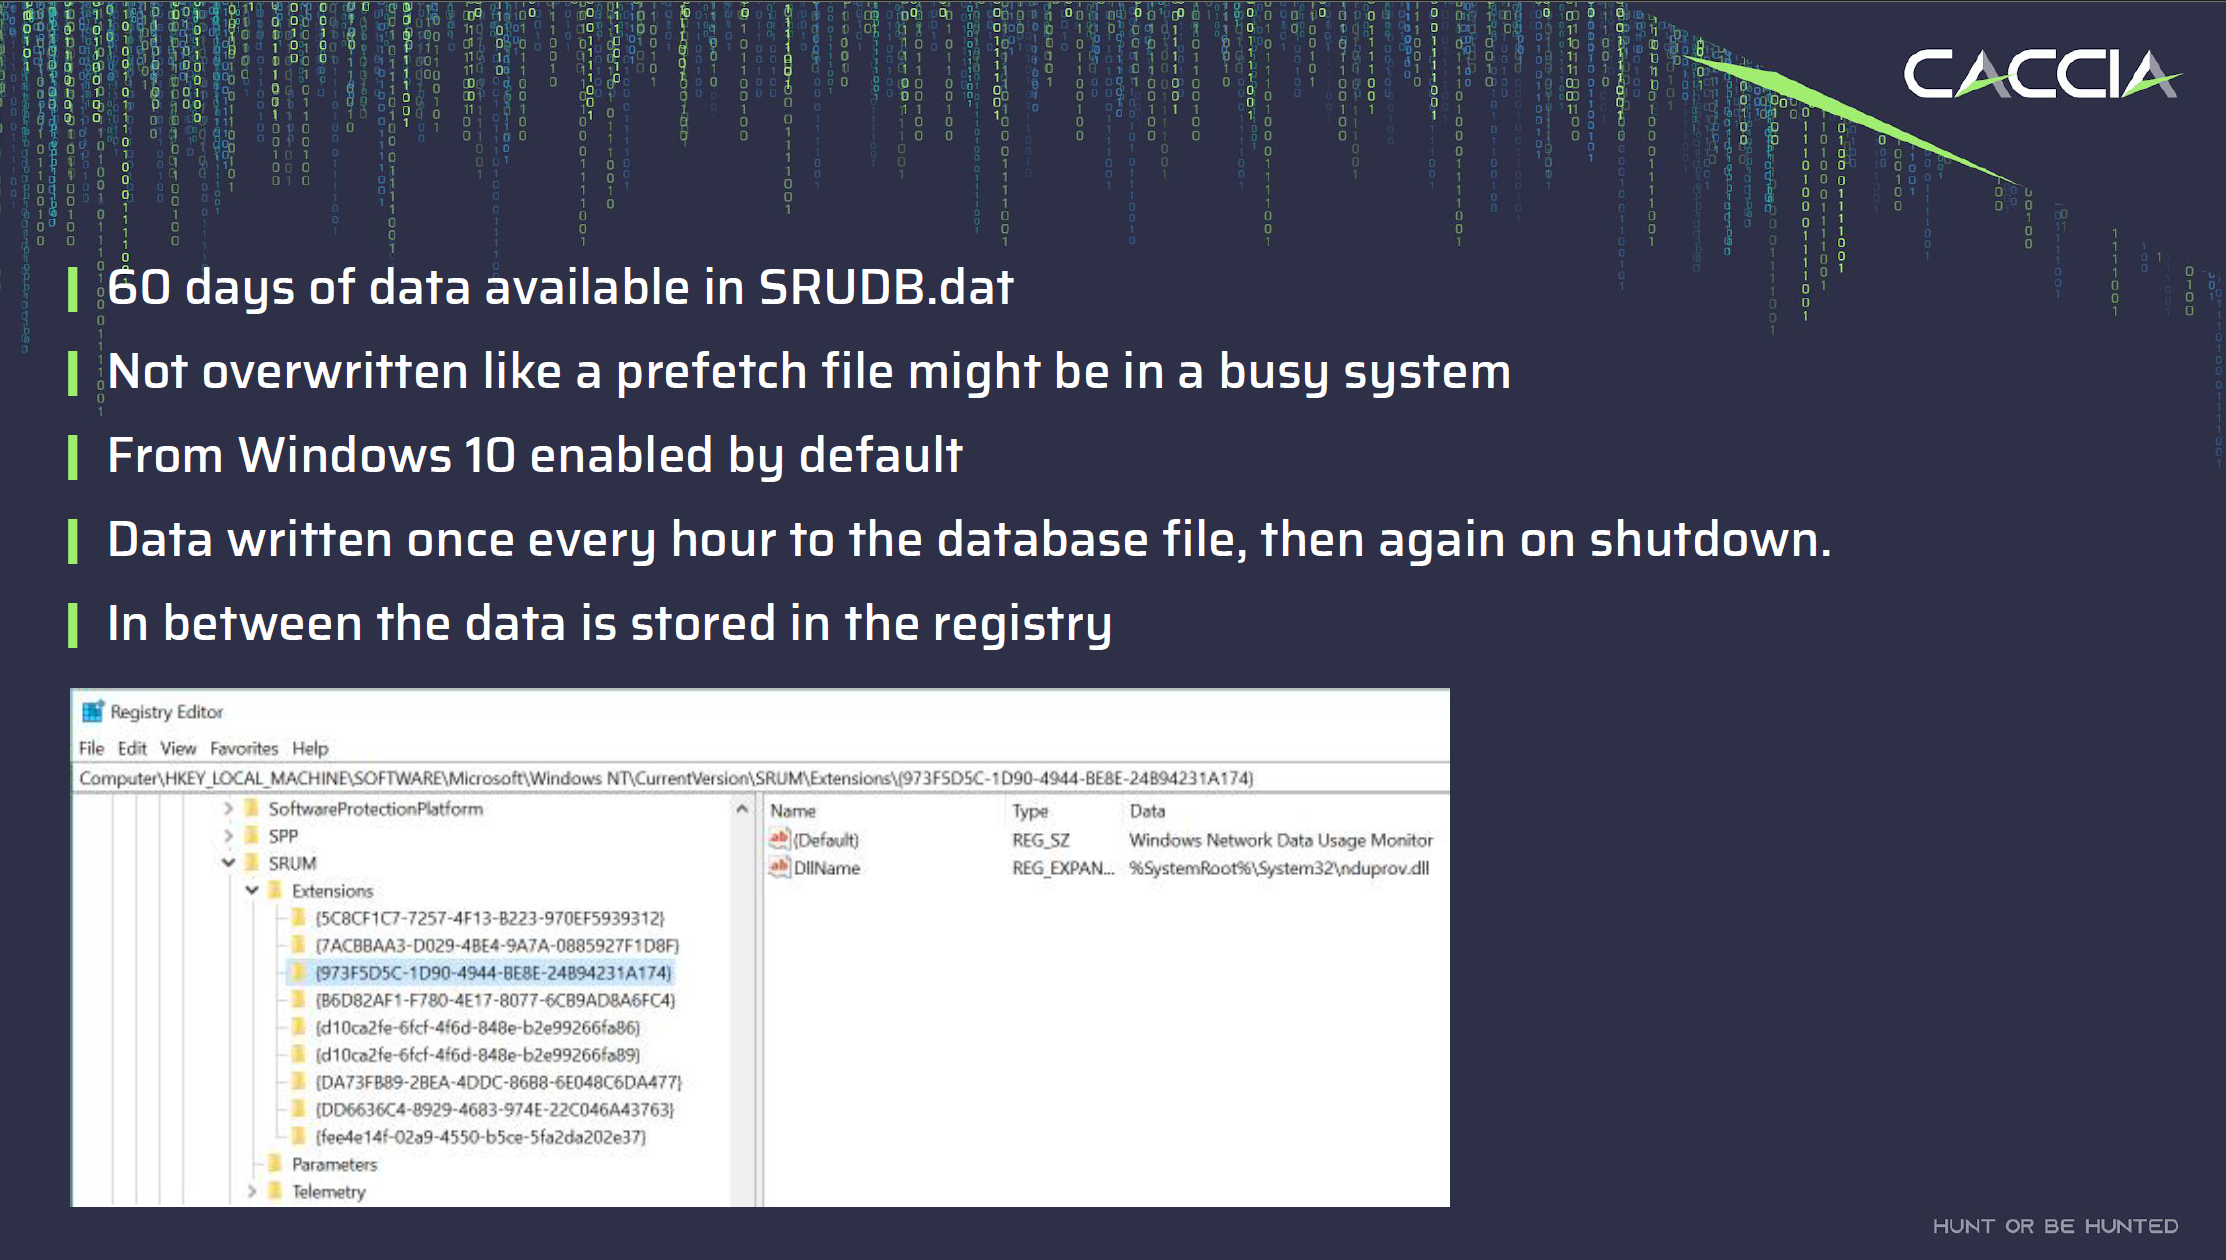
- The SRUM database retains historical data for up to 60 days. Unlike prefetch files, which have a more limited history, SRUM offers a longer window for analysing system activities. Moreover, SRUM does not overwrite files, making it a valuable resource for forensic investigations and long-term performance analysis.
- SRUM records data at regular intervals. Specifically, it is written once every hour. This frequency ensures that it captures a granular picture of application execution, user logins, network connections, and resource utilisation.
- In addition to its hourly updates, the SRUM database also records data during system shutdown events. This is crucial for capturing information about the state of the system just before it is powered off. Examining this data can provide insights into the activities leading up to a system restart or shutdown.
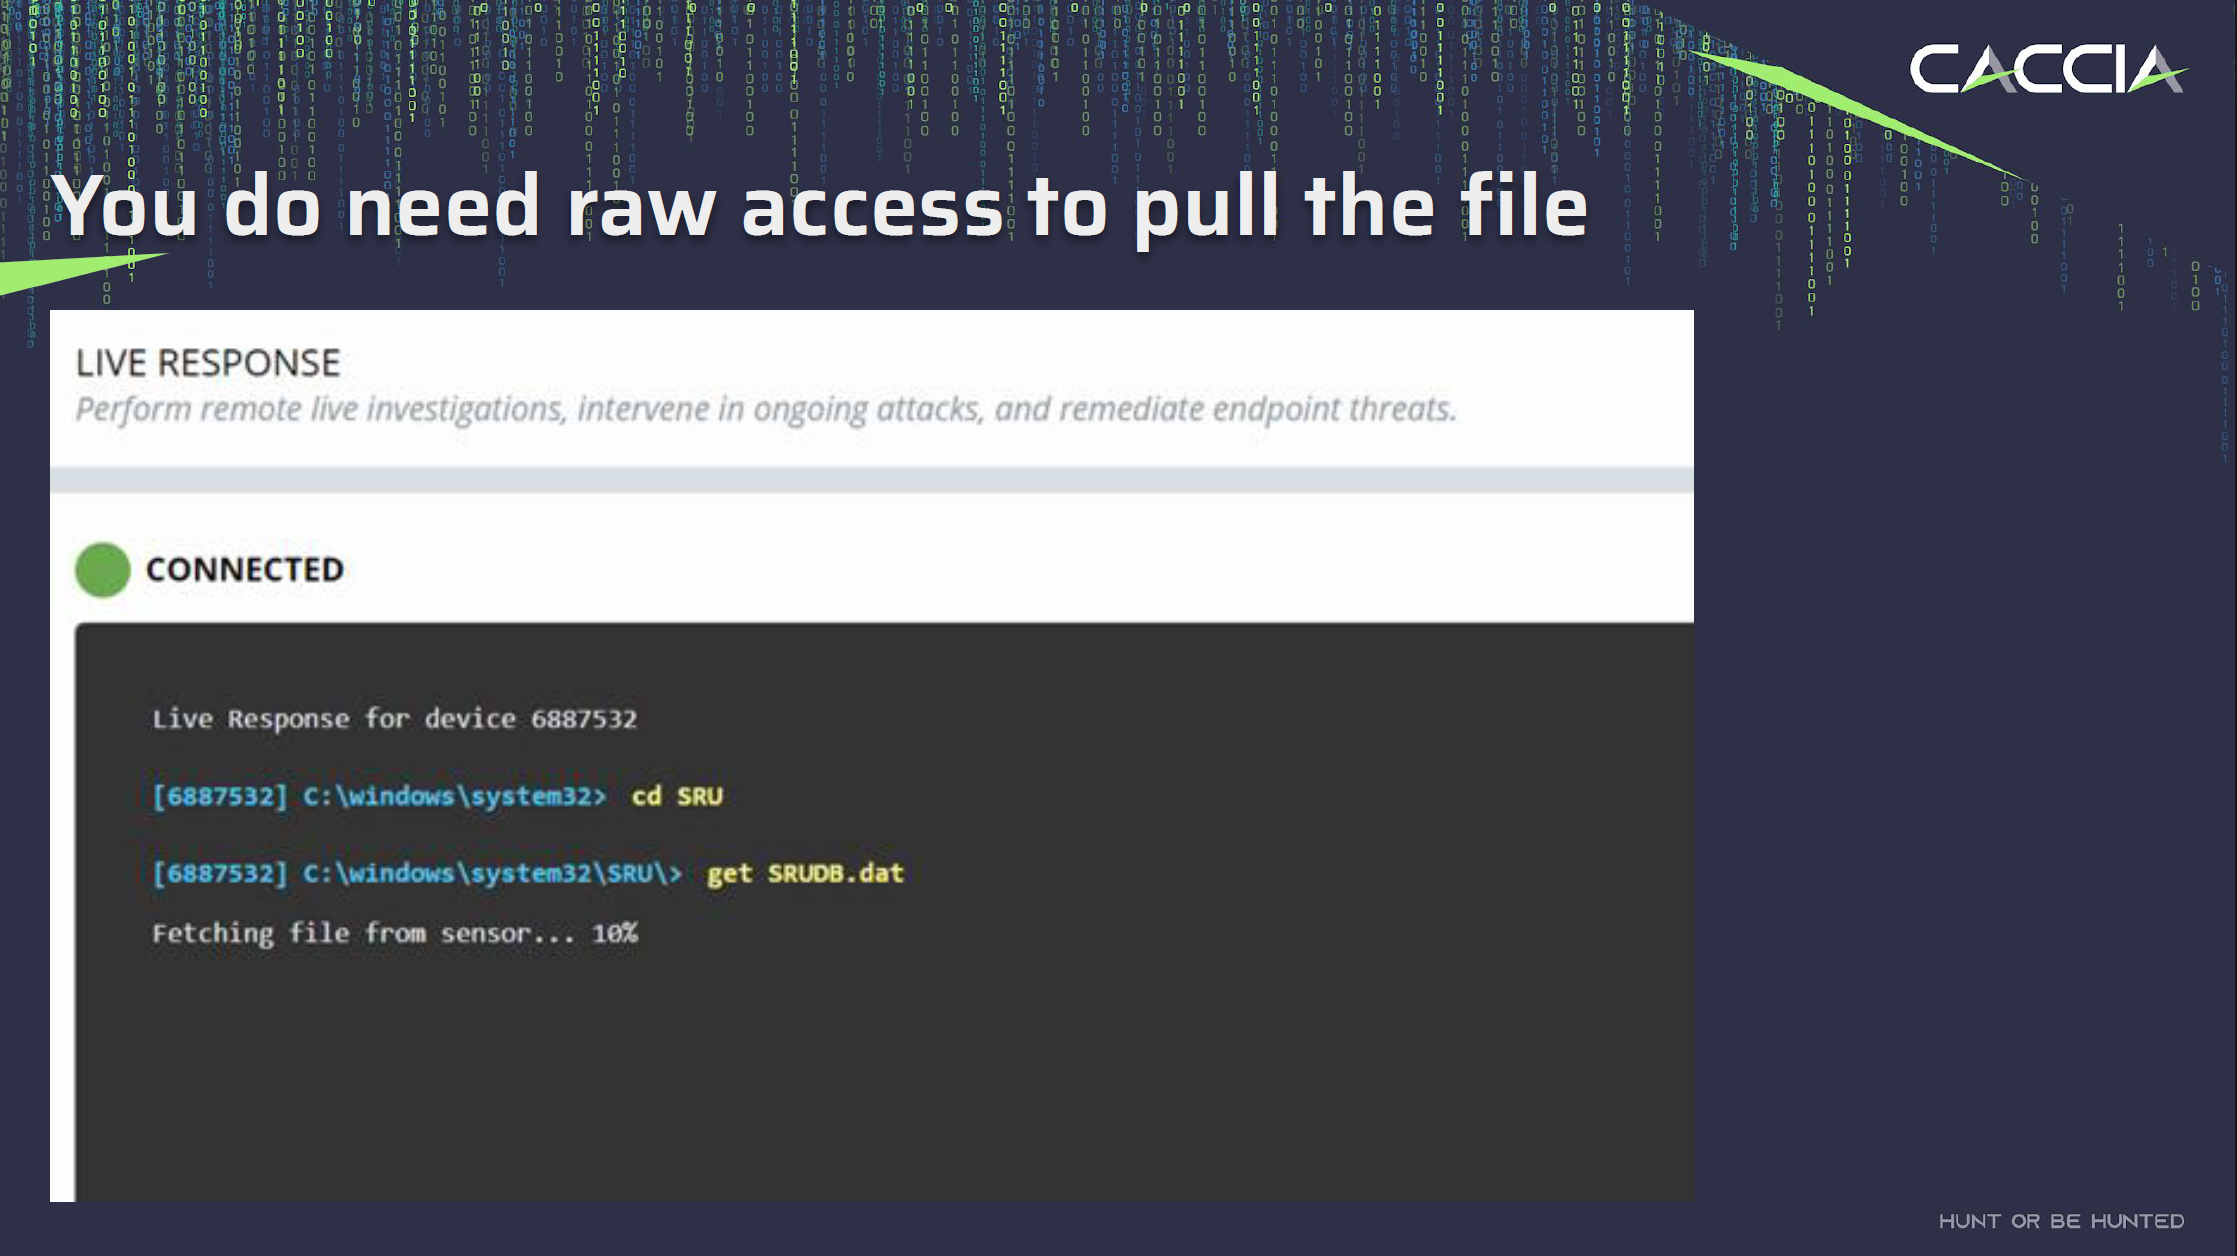
Accessing the SRUM Database #
Accessing the SRUM database, typically stored in a file named SRUDB.DAT, requires specializsd methods. It is located in c:\windows\system32\sru\srudb.dat. Since it’s a critical system file, it is not meant to be accessed directly through standard user interfaces. To retrieve data from the SRUM database, you’ll need to use techniques that provide raw access to the file or access it from a Volume Shadow Copy. These methods are commonly employed by forensic experts and security professionals for investigative and analysis purposes.
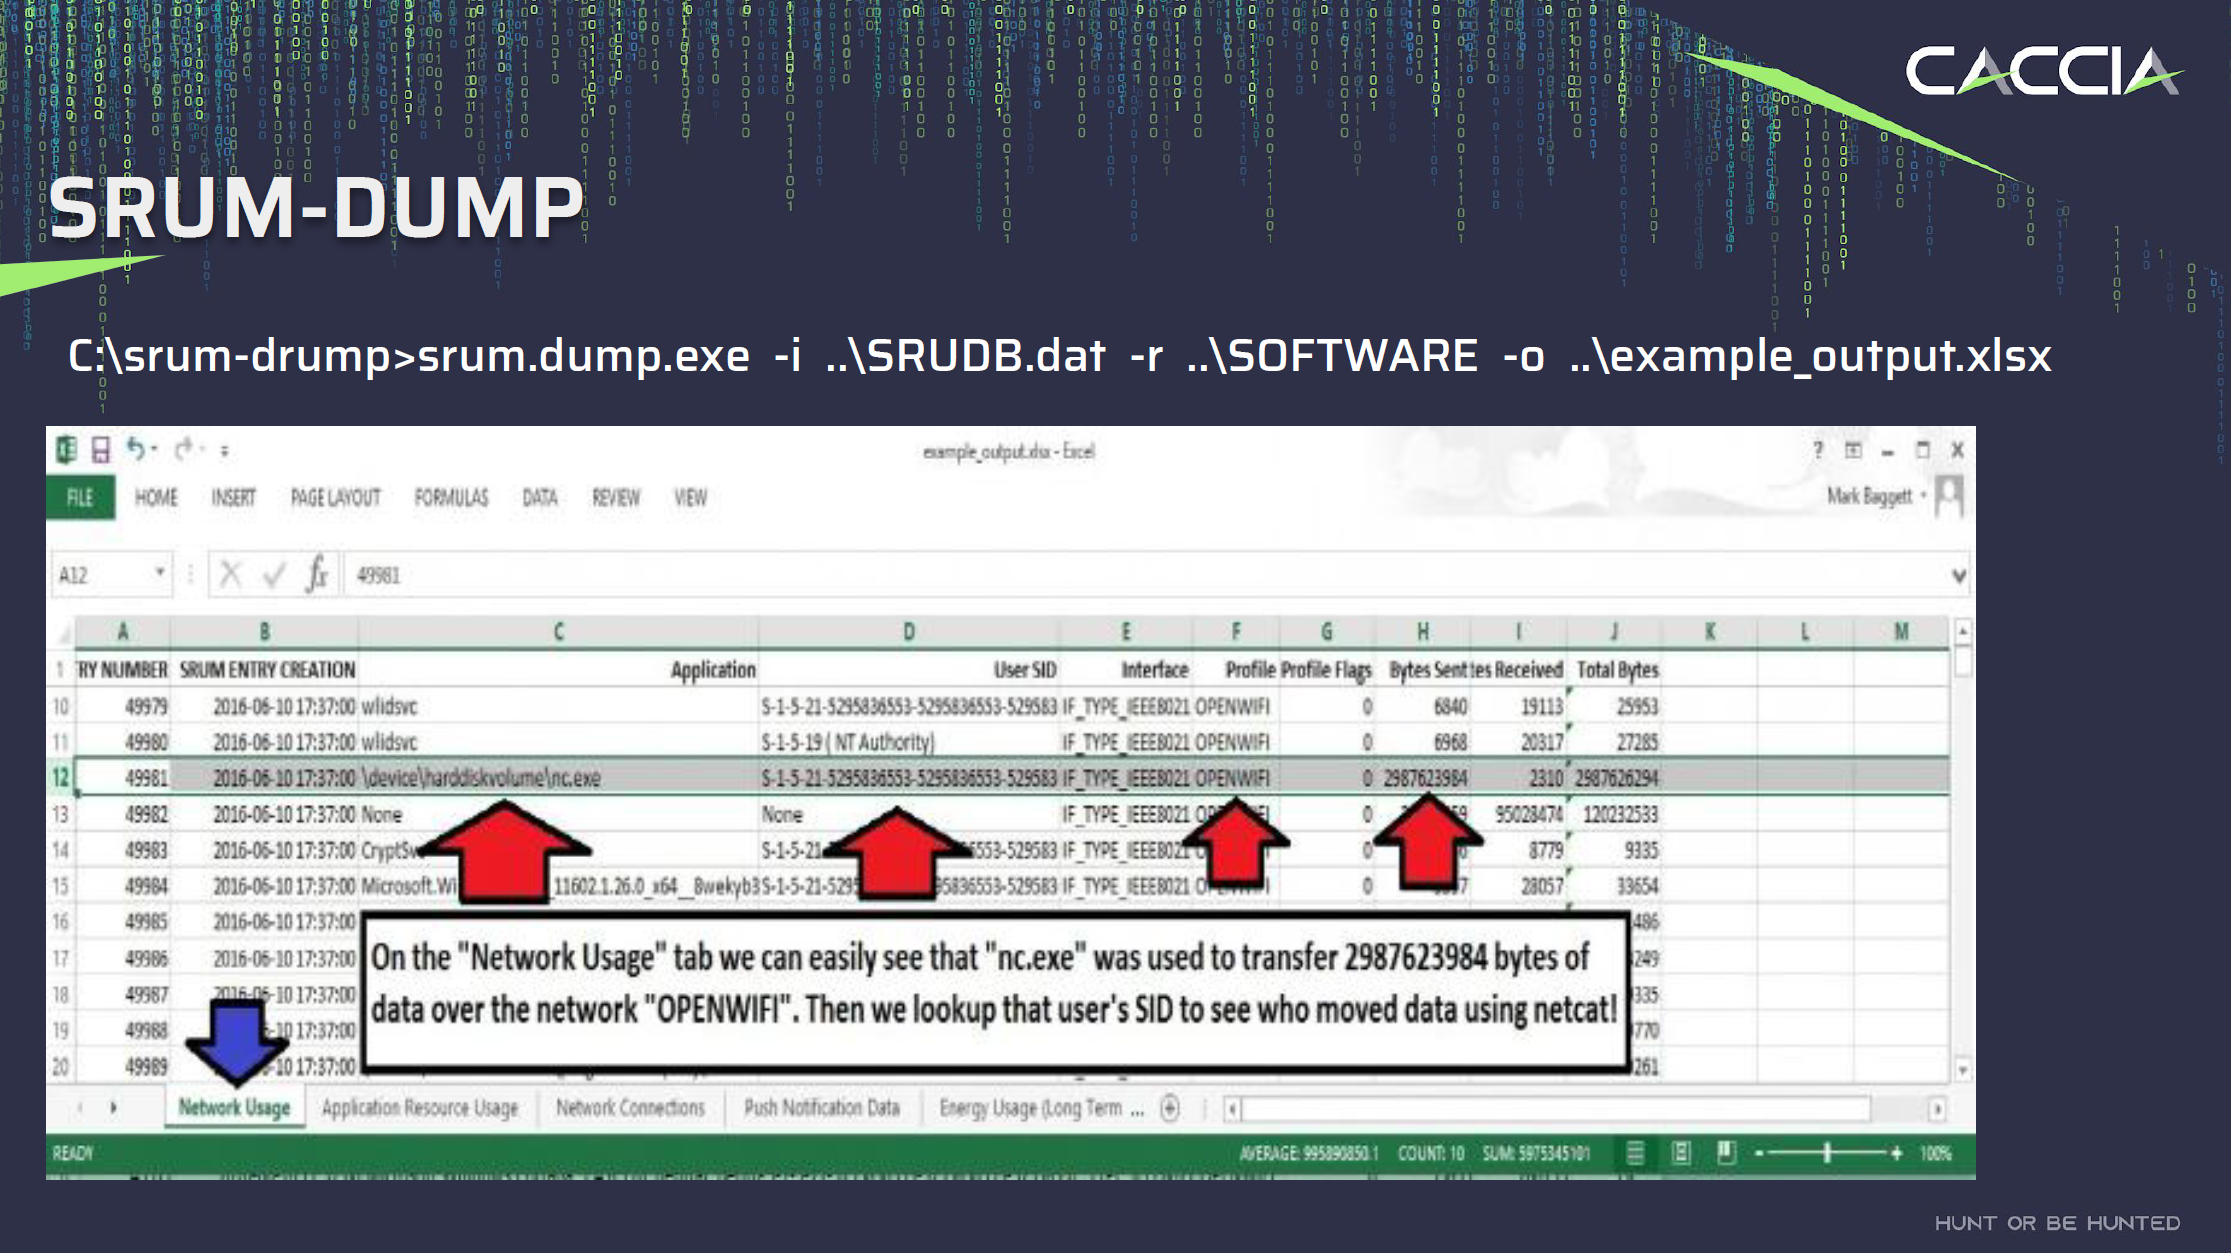
Introducing SRUM-DUMP(2) #
To parse the information I found SRUM-DUMP(2) to be a valuable tool. This tool takes the input of a SRUDB.DAT file from the system you want to analyse, and an Excel template file that specifies the fields to extract and their format.
The most recent version of SRUMD-DUMP also has a GUI interface that, when run on a system as an administrator, can access the SRUDB.dat on the system (live acquisition).
If you provide the SYSTEM registry hive as well, the tool will associated the SIDs with the appropriate usernames in the output.
How SRUM Saved the Day #
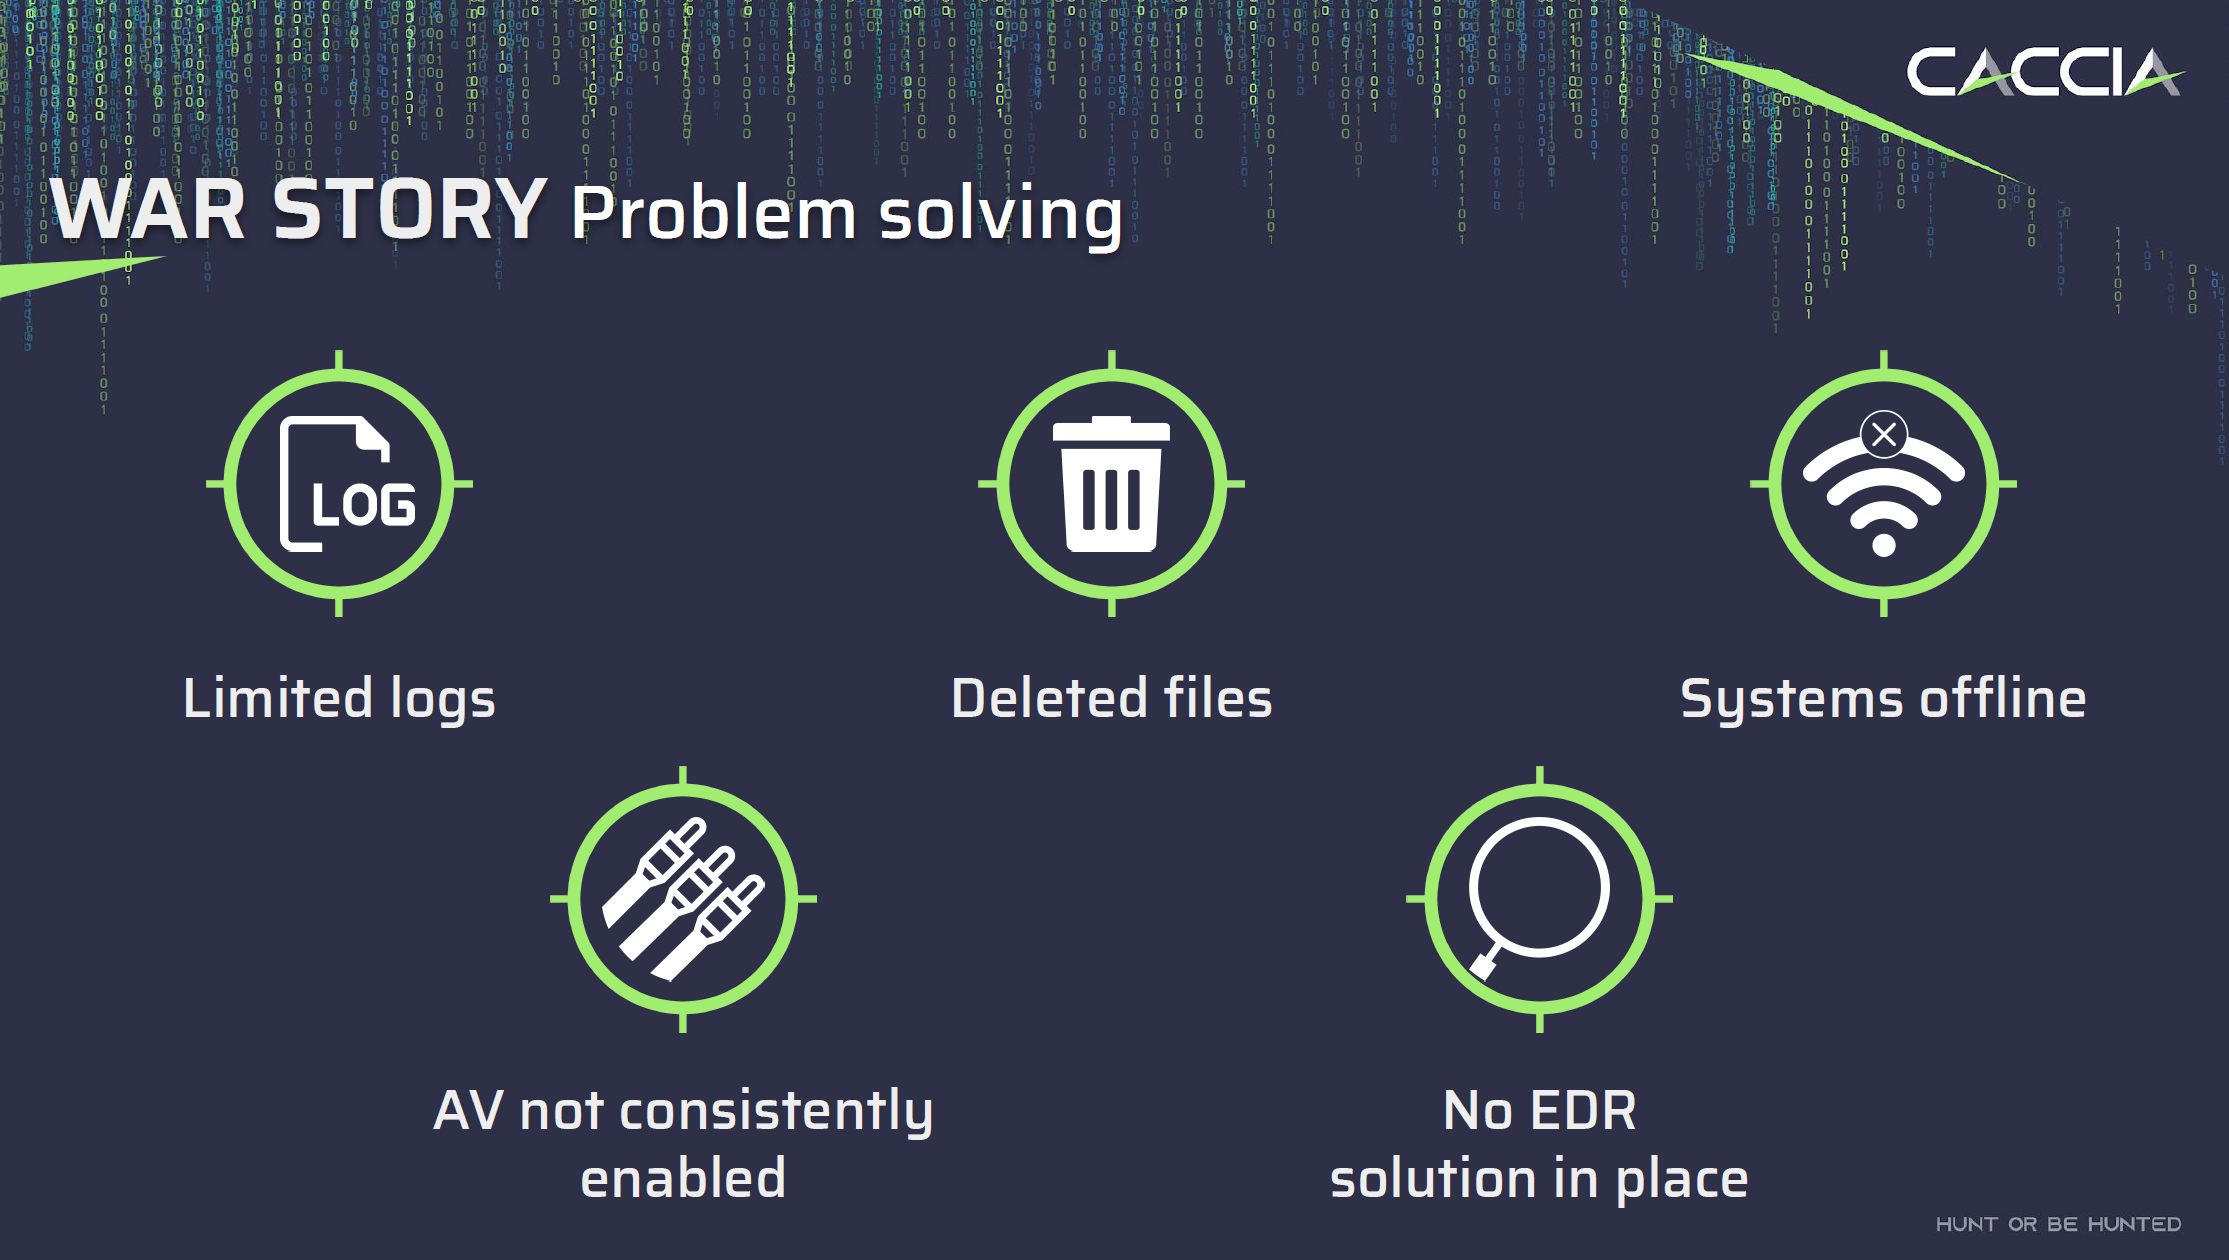
In the case I mentioned earlier, scoping was a significant challenge due to limited logs, deleted files, offline systems, sporadic antivirus deployment, and the absence of an EDR tool.
To overcome these obstacles and try and find out what the scope of the compromise was, I decided to extract all the available SRUDB.DAT files across the network, parse them, and then search for known indicators of compromise (IOCs). This allowed us to identify systems with Mimikatz usage and access by the attacker, along with related activities.
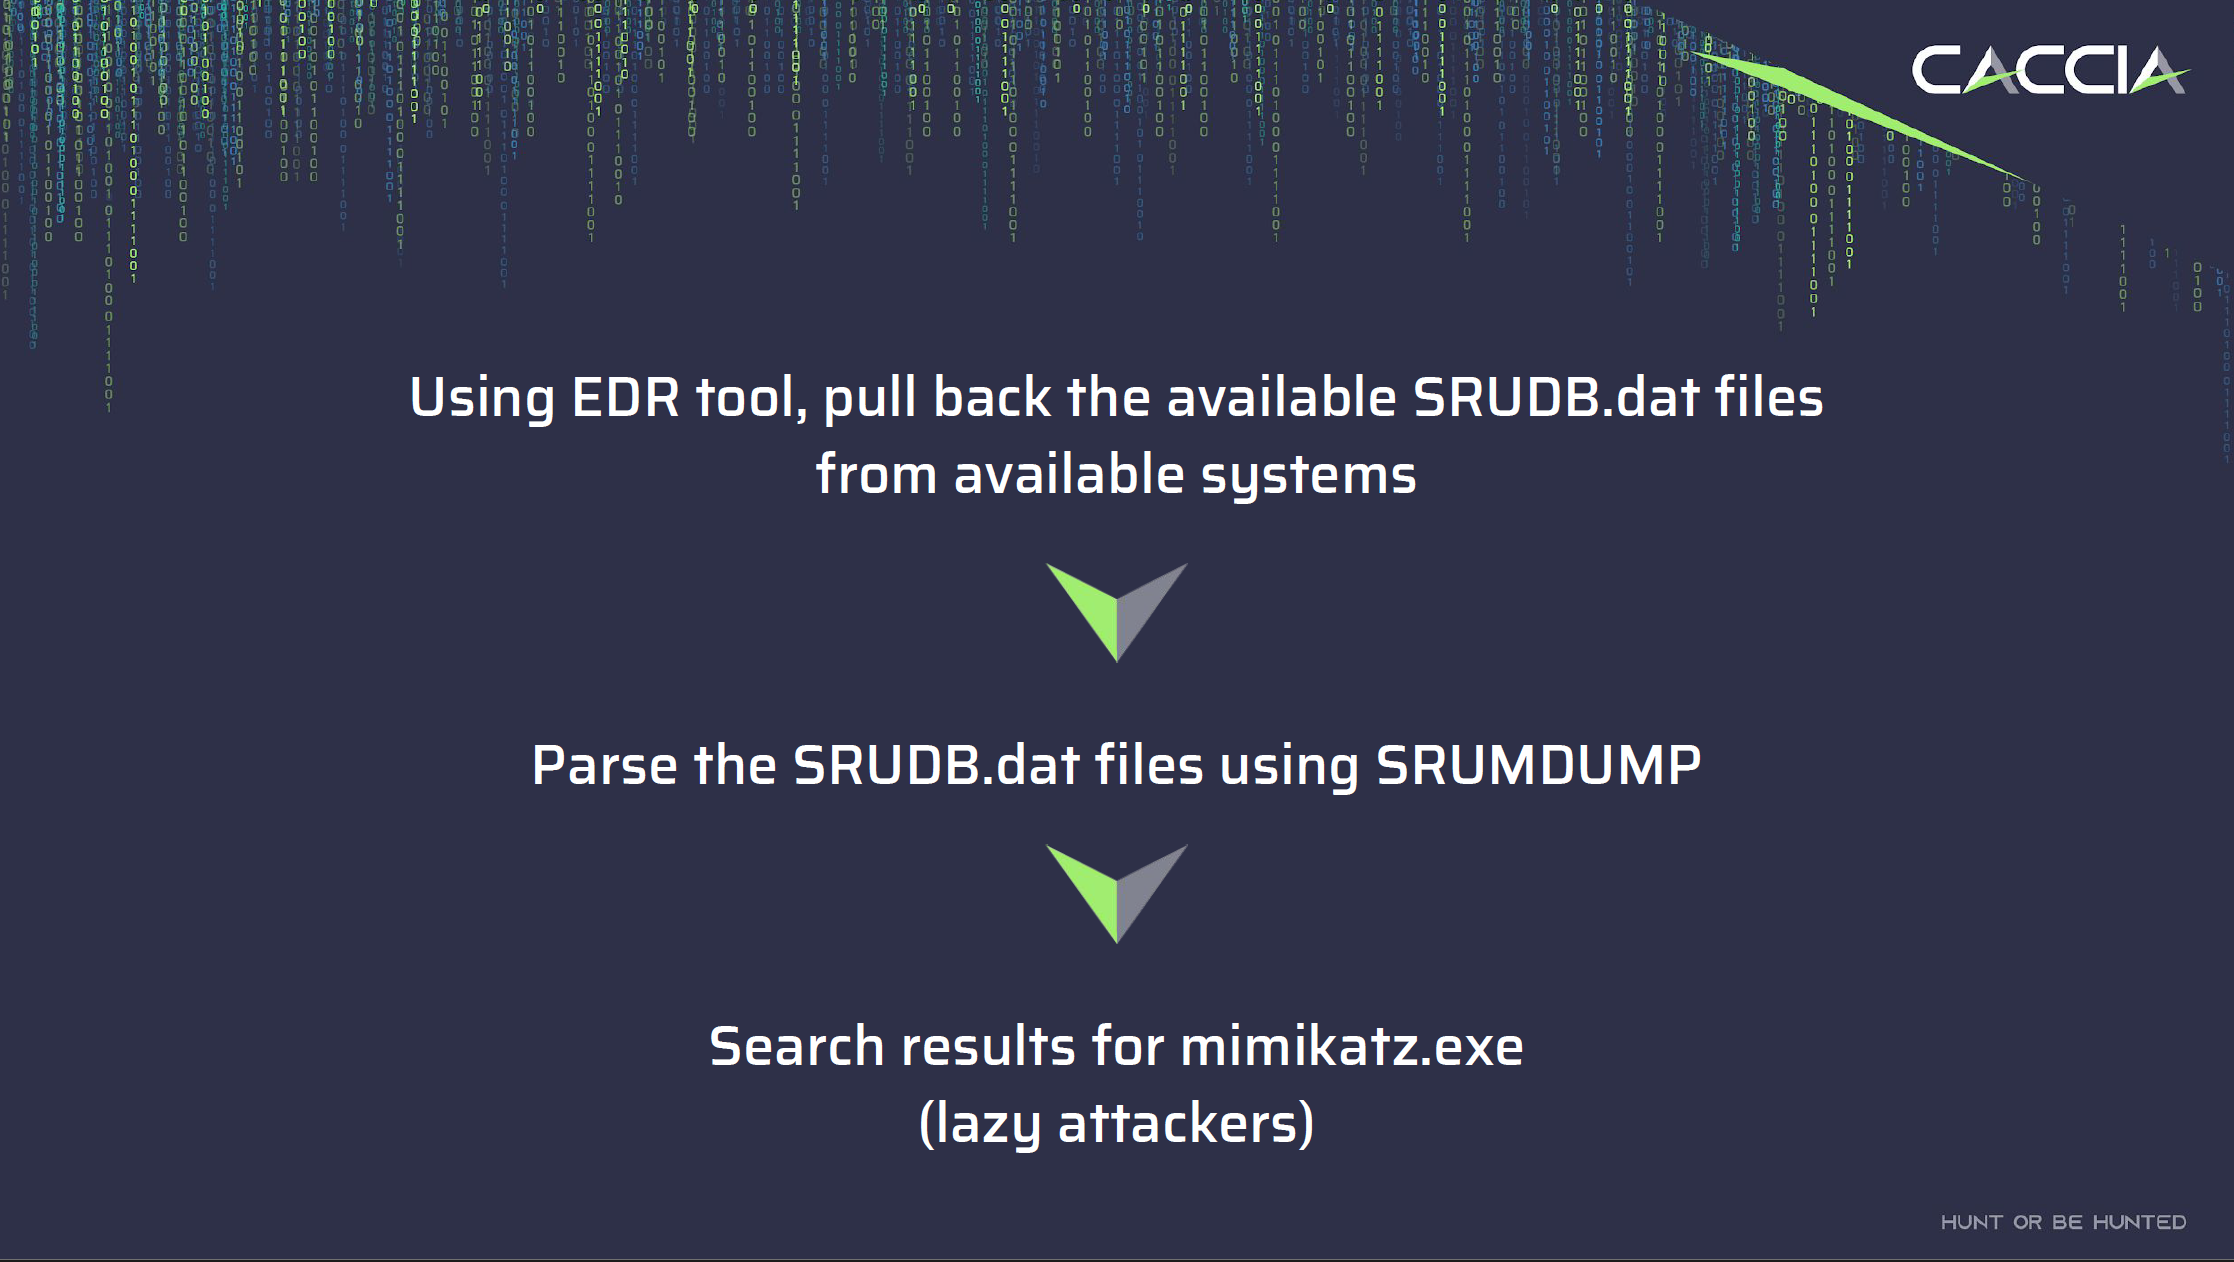
- To facilitate the collection of the artefact(s) I needed to deploy an incident response tool across the fleet. You don’t need to spend big money to achieve this, a deployment of Velociraptor, an endpoint visibility and collection tool, can easily assist in the collect of artefacts from servers and workstations.
- After acquiring all the SRUDB and SYSTEM registry files that were available, I ran a script to parse them all through
srum-dumpand output the files. - I then used Powergrep to search across the excel files to find known indicators such as the names of the malware, and applications such as
mimikatz.
With that data I was able to identify:
- Systems that the attacker ran mimikatz and other malware on that were not subsequently encrypted by ransomware. This gave us an indication of what systems they were using as their entry point and jumpbox into the network.
- Review network usage for any apps that might indicate exfiltration of a large amount of data.
- Understand what users had been compromised.
Now keeping in mind that I conducted this investigation in early 2019 and this was while I was doing my own consulting. Life is a little easier now, particularly if you can deploy a tool like Velociraptor. Velociraptor now has inbuilt plugins to collect and parse the SRUM for you.
Leveraging SRUM in Incident Response: Diverse Use Cases #
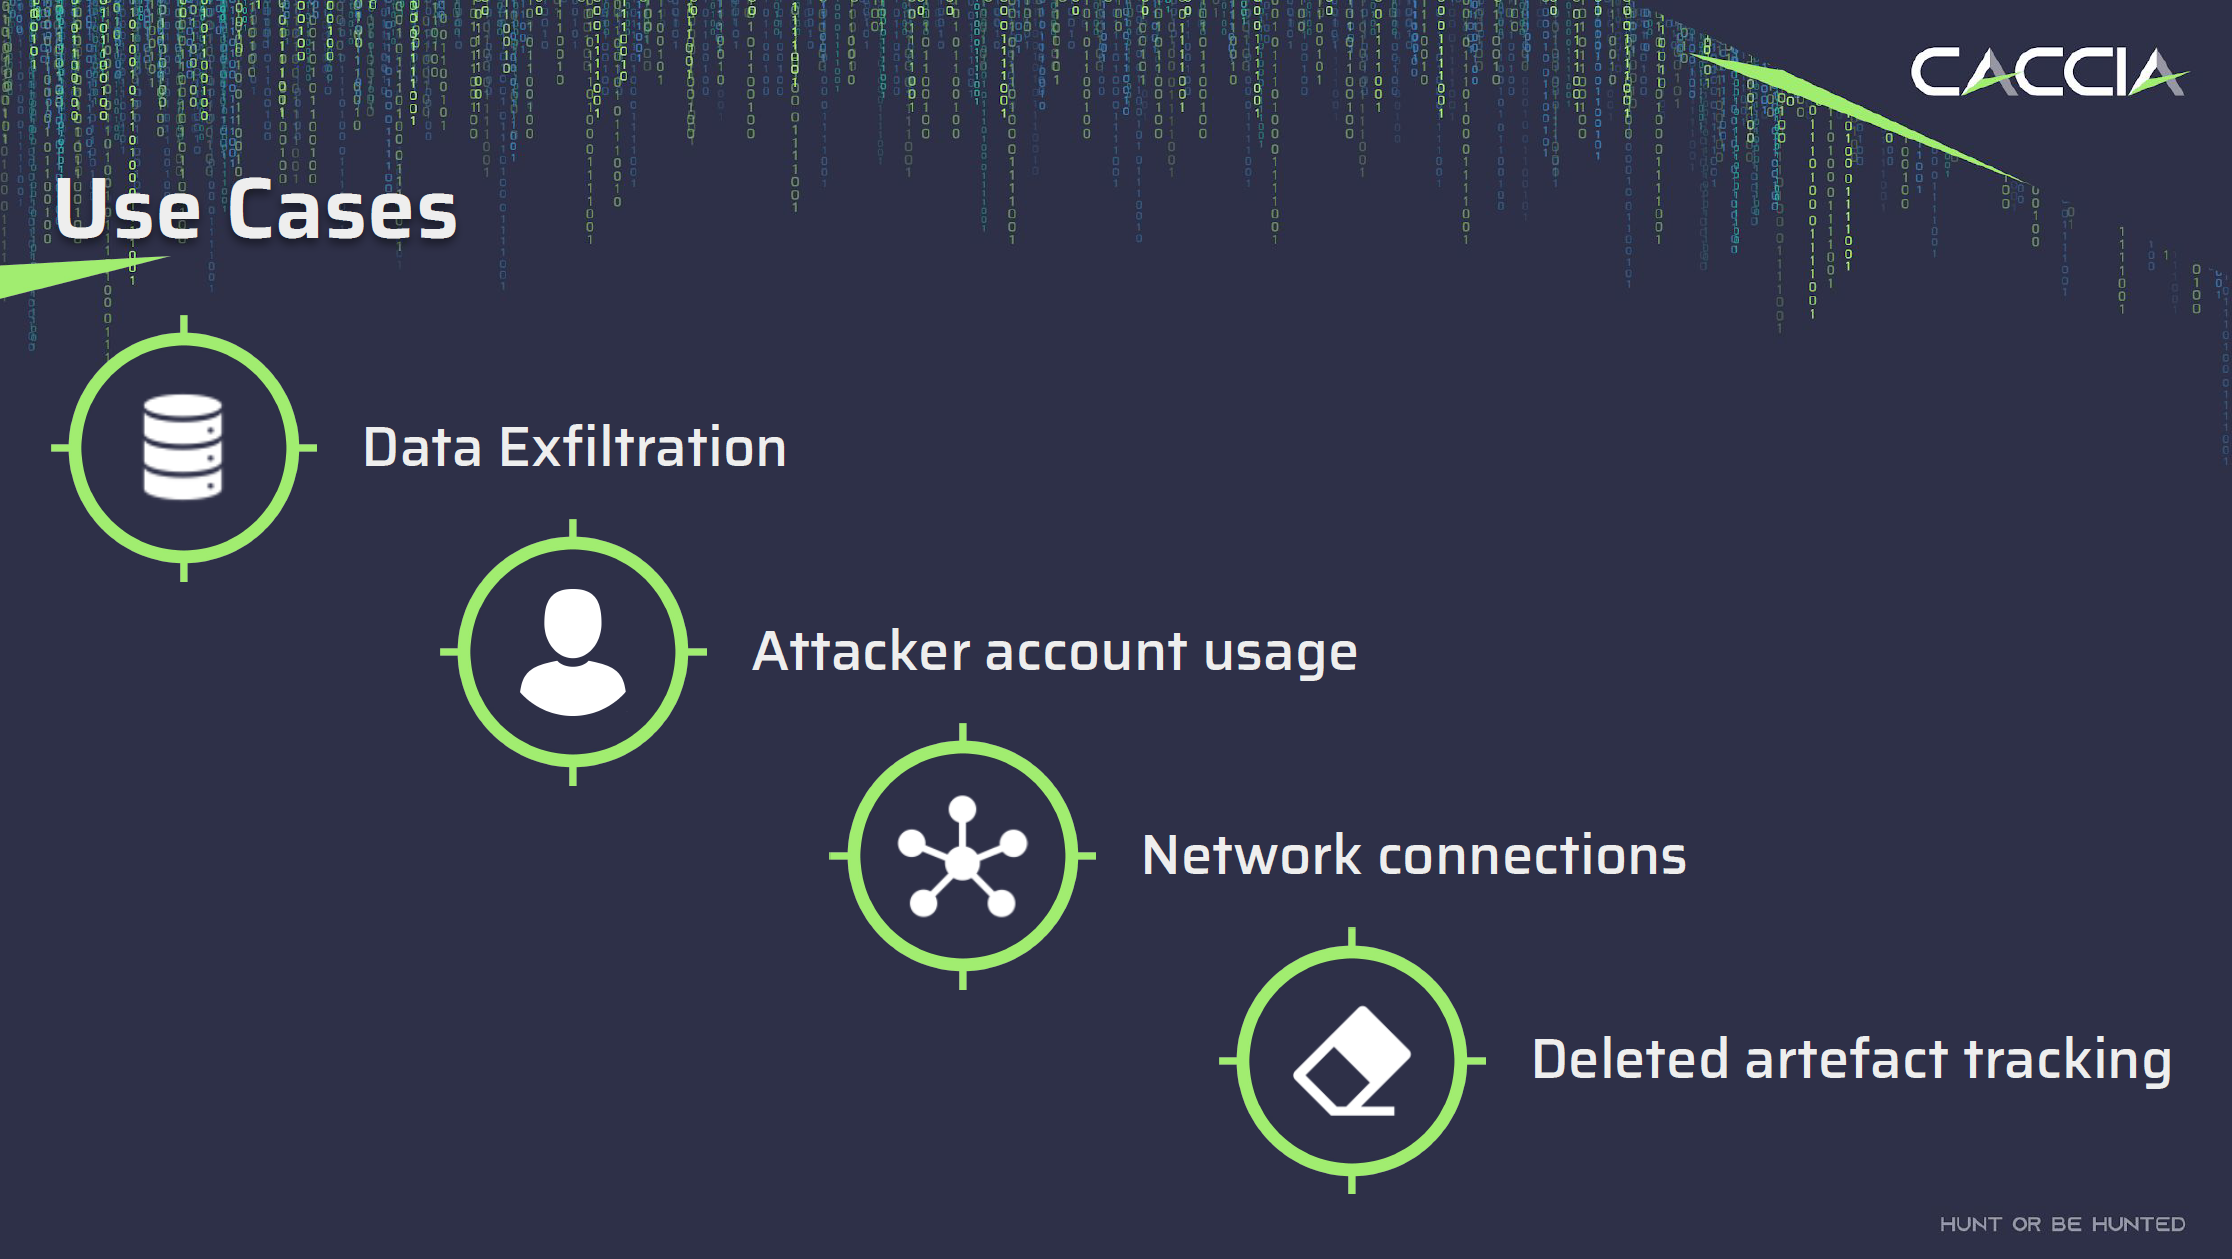
Beyond its ability to piece together timelines, SRUM offers several valuable use cases for forensic activities. These use cases provide deep insights into system activities, enabling effective incident detection, response, and investigation.
- Data Exfiltration: Track the bytes sent and received per application process to detect suspicious data transfers.
- Attacker Activity: Identify what applications an attacker ran, mapped to their user SID.
- Network Connections: Know which networks the system connected to, including data upload and download metrics.
- Deleted Artefact Tracking: Even if an executable has been deleted, SRUM can reveal the application path, user, and data usage.
Conclusion #
In the challenging world of Incident Response, having versatile tools like SRUM at your disposal can make all the difference. The SRUM database offers valuable insights into attacker activity, data exfiltration, and more, enabling investigators to build comprehensive cases even in the face of limited data.
References:
- Microsoft. (n.d.). SRUM: System Resource Usage Monitor. link
- Russinovich, M. E., Solomon, D. A., & Ionescu, A. (2017). Windows Internals, Part 1. Microsoft Press.